Business Insights Portal
Colaborative Analysis and Reporting
Buisness Insights Portal is a powerful analytical and reporting tool built for the Web.
It is basically a CubePlayer variant that runs in your Web Browser. It only requires a single installation on your company's Intranet Server, allowing a number of users to work simultaneusly. Many features found in CubePlayer are also included in this product, allowing you to easily analyze your data in a number of ways.
Business Insight Portal connects to and works with a number of differrent data sources, including Microsoft Analysis Services, Microsoft SharePoint PowerPivot, Microsoft Reporting Server, Oracle 11gR2 cubes (via Simba for Oracle provider), just to name a few.
It features the Control Panel that is similar to the one found in CubePlayer. You can easily, by using simple drag-and-drop actions, organize reports in a fashion that suits your needs. You can have as many control panels as you like, and switching between them is just a simple click on the needed one from a list.

Portal consist of three distinct sections – the Viewer, the Designer and the Editor.
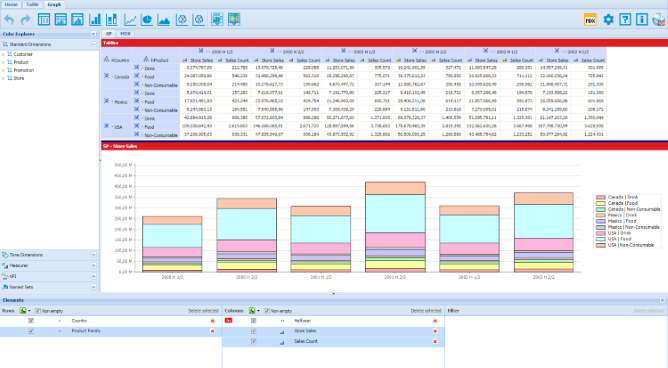
The Viewer allows you to work with various types of your data representation, including Dynamic and Static Reports. It also features Dashboards, enabling you to work with multiple reports side-by-side in a single, customizable window. It uses the same data formats as the other products of our Business Insights Suite, including CubePlayer and Business Insights 2.
Each report can be represented in a form of a table, a chart, or both. You can use reports created in CubePlayer (or Business Insights 2) in their original form, or you can alter them by adding dimensions and measures to it, or by changing parameters. You can chose from a number of chart types, including (but not limited to) Bars, Pie, Lines or Area. And with the use of Measure Pair Dialog, you can visually compare values from differrent measures in a single chart.
The Designer enables you to easily build reports from scratch, by using simple and intuitive drag-and-drop technique. Thus you can add elements of your analysis (such as levels, members or measures) directly to your rows, columns, or filter. Powerful MDX Functions can be easily applied to your elements. Resulting reports can, in the same manner as it is in the Viewer, be presented in a form of a table, a chart, or both.
The Editor allows you to work directly with MDX code. If you prefer coding your report, or are just curious about how your report looks „under the hood“, the Editor will do the job.